qPCR
*HSP 70 threshold=0.8
MT threshold=0.7
GPx threshold=0.8
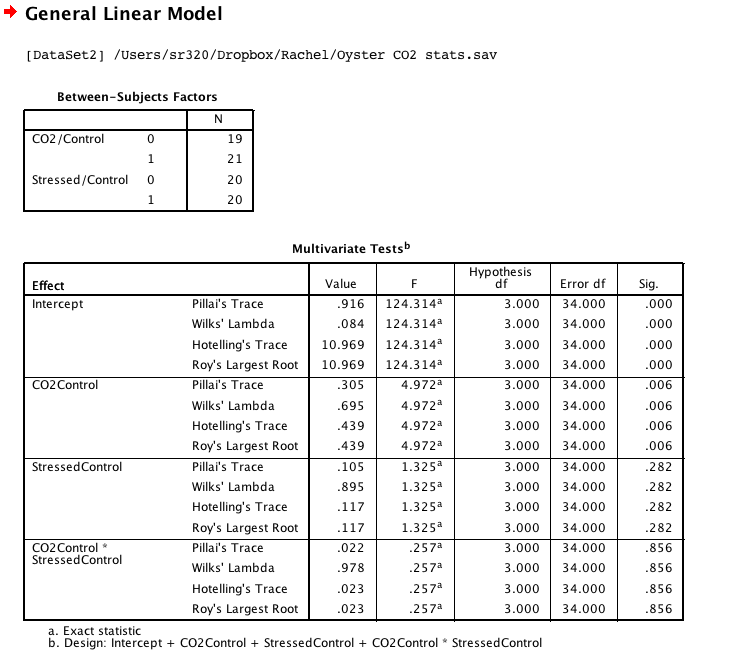
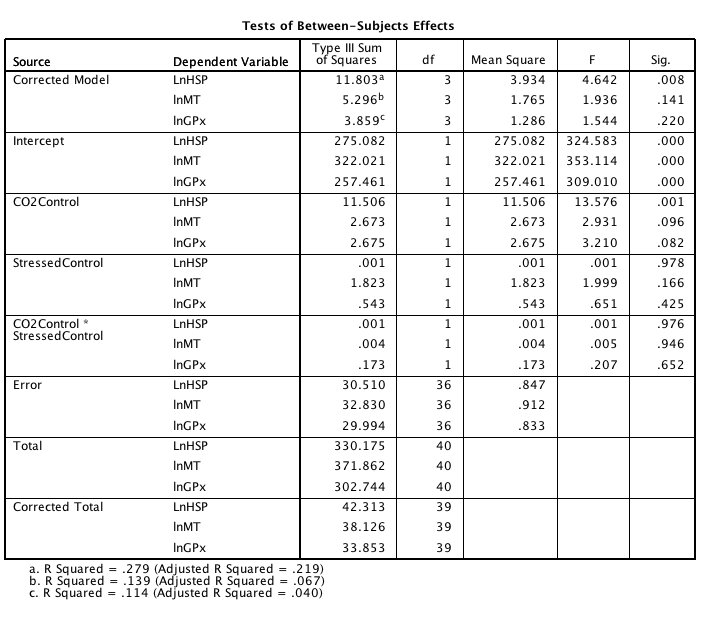
All data was natural log transformed prior to statistical analysis. Differences in gene expression levels were analyzed using a 2-way ANOVA (n=11 in 2 groups and n=12 in 2 groups), with significance defined as P0.05.
Where might raw data be?
other cut stuff
Reference for use of ef-1 as good housekeeping gene (not specifically about oysters, but in general): "ubiquitous protein that binds aminoacyl-transfer RNA to ribosomes during protein synthesis"
Control genes in quantitative molecular biological techniques: the variability of invariance
Stephen R. Stürzenbaum
References: Transcriptional expression levels of cell stress marker genes in the Pacific oyster Crassostrea gigas exposed to acute thermal stress
Quantitative expression analysis of nacreous shell matrix protein genes in the process of pearl biogenesis
stats